How Many Mbps Do Your Customers Need?
How Many Mbps Do Your Customers Need?
Customers are continuously pushing for higher Mbps. Determine what speed they need, the amount of capacity your ISP has, and ways to avoid overselling,
How To

Contributor By:
Maxwell Kamau
10 Oct,2026, 18:07
You upgrade a customer from 5 Mbps to 10 and the complaining continues. It is a common thing, and almost always a sign that speed was not the issue. It could be delay, too many customers on the same pipe, or a badly sized package based on guesses. What the customer knows is that the internet feels slow, and that they are paying for it.
Mbps in plain words
Mbps stands for megabits per second, a measure of the data moving through a connection each second. A bit is the smallest unit of data, and eight bits make one byte, which causes confusion as phones and download managers usually show speeds in MB/s (with a capital B). You divide the Mbps figure by eight to get MB/s and a 8 Mbps plan can download at best around 1 MB per second, taking 100 seconds to download a 100 MB file. When a customer says they paid for 10 Mbps but their download speed shows 1.2, the connection is often fine. They are comparing bits with bytes.
Bandwidth is the theoretical maximum of a connection, like the width of a pipe. Throughput is the speed achieved (equal to or lower than bandwidth), and latency is the delay (in ms) the internet introduces before data arrives. Latency defines the responsiveness of the internet, no matter how wide the pipe is.
Why more speed does not always fix the complaint
A video call needs very little bandwidth (usually 1 to 3 Mbps), what wrecks a call is instability. Jitter is the variation between the delays of data packets, and packet loss is when packets do not arrive. A 100 Mbps connection with spikes of 400 ms latency is worse than a 10 Mbps one.
A common cause is bufferbloat, where a big download fills the waiting line (the buffer) in your router, with every other packet waiting behind it and causing ping times to jump. Smart queue management, such as fq_codel on newer MikroTik versions, keeps that line short. Before you promise a customer a faster plan, check if the real issue is delay.
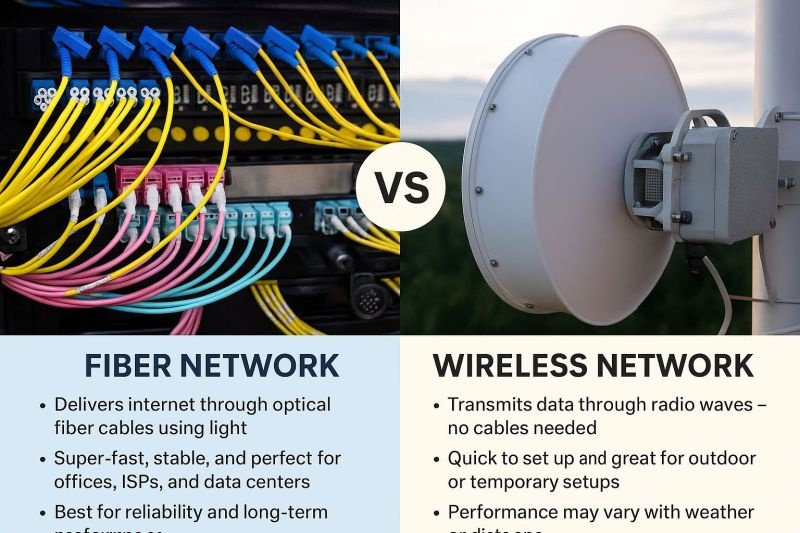
Video calls, photo and video uploads, cloud backups, live streaming and remote CCTV viewing, all push data out and many wireless setups give less upload than download. Fiber usually gives symmetrical speeds (upload = download). If your customers are small businesses with cameras or video meetings, ask about upload before you set the package.
What customers actually use
These figures are rough averages that change with the app and quality setting, but give a working picture. Browsing and social media: 1 to 3 Mbps. Music: well under 0.5 Mbps. WhatsApp voice call: less than 0.1. One-to-one video call: 1 to 3 Mbps in both directions. Group call (Zoom or Meet): 2-4 Mbps. Standard definition video: 1-3 Mbps, HD: 4-8 Mbps, 4K: 15-25 Mbps. Online games: 1-3 Mbps, but punish high latency. Large downloads and app updates take every bit of bandwidth, and is why one phone updating an app can slow a whole hotspot.
To size a package, add up what people do at the same time, and add 20-30 percent headroom for when several peak together. One browsing needs around 3-5 Mbps. A couple streaming in HD while one is on a call needs around 10-15. A family of four with two streams, a call and phones in use needs around 15-25. A busy home with 4K streaming, gaming and people working remotely needs 30-50 or more. A small shop or cafe with card machines, CCTV and a few staff needs roughly 10-20, with decent upload.
One more trap sits in the customer's own Wi-Fi. A router may advertise a link rate of 300 or 600 Mbps, and customers assume that is their speed. Real throughput is often half the link rate or less, due to protocol overhead, shared airtime and interference, and it gets worse in weak signal. A customer paying for 20 Mbps may measure 12 on their phone from the far room, despite your connection being healthy.
Working out the capacity your ISP needs
You need enough total bandwidth for all customers at your busiest hour, and you do not need enough for every customer at full speed. Start by counting your customers. Next, estimate concurrency (share of customers actively using data at same moment during peak hours). For a typical hotspot, 10-30 percent is a fair starting guess, and you should replace it with your own measurements as soon as you can. Then estimate the average demand per active customer (using the figures above). For a mixed crowd, 2-4 Mbps is a common working number. Multiply, and add headroom.
Here is a worked example with made-up numbers. With 200 customers and 20 percent active at peak, 40 people are online at once. At an average of 2.5 Mbps per person, that is 100 Mbps. Add 25 percent headroom and the ISP needs roughly 125 Mbps of real upstream capacity, even if it sells faster individual packages.
Now compare what you promised with what you have. If those 200 customers each have a 5 Mbps cap, you have promised 1,000 Mbps on 125 Mbps of real capacity. That is a contention ratio of 8 to 1, meaning eight units of promised speed share each unit of real capacity. It works because customers rarely all pull full speed together. Business and priority customers deserve a lower ratio (they expect steady speed all day) while home and hotspot customers can tolerate a higher one. The ratio is a planning tool, and the real test is the experience at your peak hour.
Setting package speeds and checking the results
Good packages use your capacity well and still feel generous. Keep the menu simple (4 or 5 tiers: 3, 5, 10 and 20 Mbps) and link each tier to a use (browsing and WhatsApp at the bottom, families or small businesses at the top). A short burst above the cap for a few seconds at higher speed makes pages open fast even on a small package, and MikroTik queues support burst settings. For fair sharing, PCQ (per connection queuer) splits bandwidth evenly between active users (so one heavy downloader cannot starve everyone else). Label speeds as "up to" a number (if that is what they are). Customers forgive honesty and punish surprises.
Replace estimates with your own data. Watch your router's traffic graphs during the busiest hours (usually 7pm-11pm), using MikroTik's built-in graphing, Torch or an SNMP tool such as The Dude. Many ISPs plan capacity using the 95th percentile (ignores the top 5 percent of spikes) which shows your normal busy level, a fairer picture than a single peak. Test speed more than once, at different times, and at both the router and the customer's device. If the speed is fine at the router and poor at the customer, the problem lies in the last mile or the Wi-Fi. Keep a note of when/where customers complain (patterns point to causes).
Upgrade your upstream when evening speeds fall below what you sell by an amount customers notice, when your 95th percentile is close to your total capacity, or when complaints climb as you add customers. Adding capacity before those points costs less than losing people who leave without a word.
Three numbers to write on your wall
Everything above comes down to three figures: how many customers you have, what share are active at peak, and what each active customer uses. Multiply, add headroom, and compare to what you pay for. Billing helps here, as caps are easier to enforce when each customer's plan is set in one place. Noch Wired supports plans and session limits, so the speeds you design are the speeds customers get.
Start earning today with Noch Wired
Popular Posts